Maps & Plats
Reading the Old Plats: A Field Guide to the Stories Hidden in Survey Records
How to read title blocks, bearings, monuments, notes, linework, and historical context without mistaking a beautiful drawing for the whole survey.
On This Page
- 01 — Introduction
- 02 — Start with the document’s identity
- 03 — First example: a river town with north to the right
- 04 — Second example: a township inside a published atlas
- 05 — Read dimensions as a language
- 06 — The notes explain what the linework cannot
- 07 — Bring an old sheet into GIS without giving it false precision
- 08 — Sources and further reading
An old plat can look wonderfully precise: fine ink lines, elegant lettering, numbered parcels, and a surveyor’s signature. Yet the first question to ask is not how accurately the sheet was drawn. It is what the document was intended to do. A government township plat, a recorded town subdivision, and a commercially published landownership atlas may resemble one another while carrying very different kinds of information and authority.
Reading these records well means learning to move between the picture, its words, and its history. The reward is more than deciphering an old map. A careful reader can begin to reconstruct how land was measured, divided, occupied, and described—and identify the questions that still require evidence on the ground.
Start with the document’s identity
Before following a line, identify the title, place, date, creator, and source of the copy. Look for a survey date, an approval date, and a recording reference; they may describe different events. A plat drawn from an older survey and published decades later has at least two historical contexts. The date printed on the sheet need not be the date someone measured its lines.
Then establish the document’s purpose. An approved federal township plat records a particular public-land survey. A subdivision plat may establish a numbered lot-and-block arrangement and include dedications or certificates. A county atlas may compile landowner names from available records for a commercial readership. Each can be useful, but their roles should not be silently substituted for one another.
The version matters as well. An original drawing, an official recorded copy, a later tracing, and a modern digital scan are different objects. A recorded copy may preserve a transaction exceptionally well without preserving the surveyor’s handwriting. A scan may omit a reverse-side endorsement or make a faint annotation disappear. Record the archive’s identifier and inspect the full sheet, not just the attractive central drawing.
First example: a river town with north to the right
George Washington’s 1749 plan of Alexandria, then also called Belhaven, is a useful place to practice. The Library of Congress catalog identifies it as a cadastral map showing lots and lot numbers, and notes an easily overlooked fact: north is to the right. Reading the top of the sheet as north would rotate your understanding of the town before you had examined a single parcel.
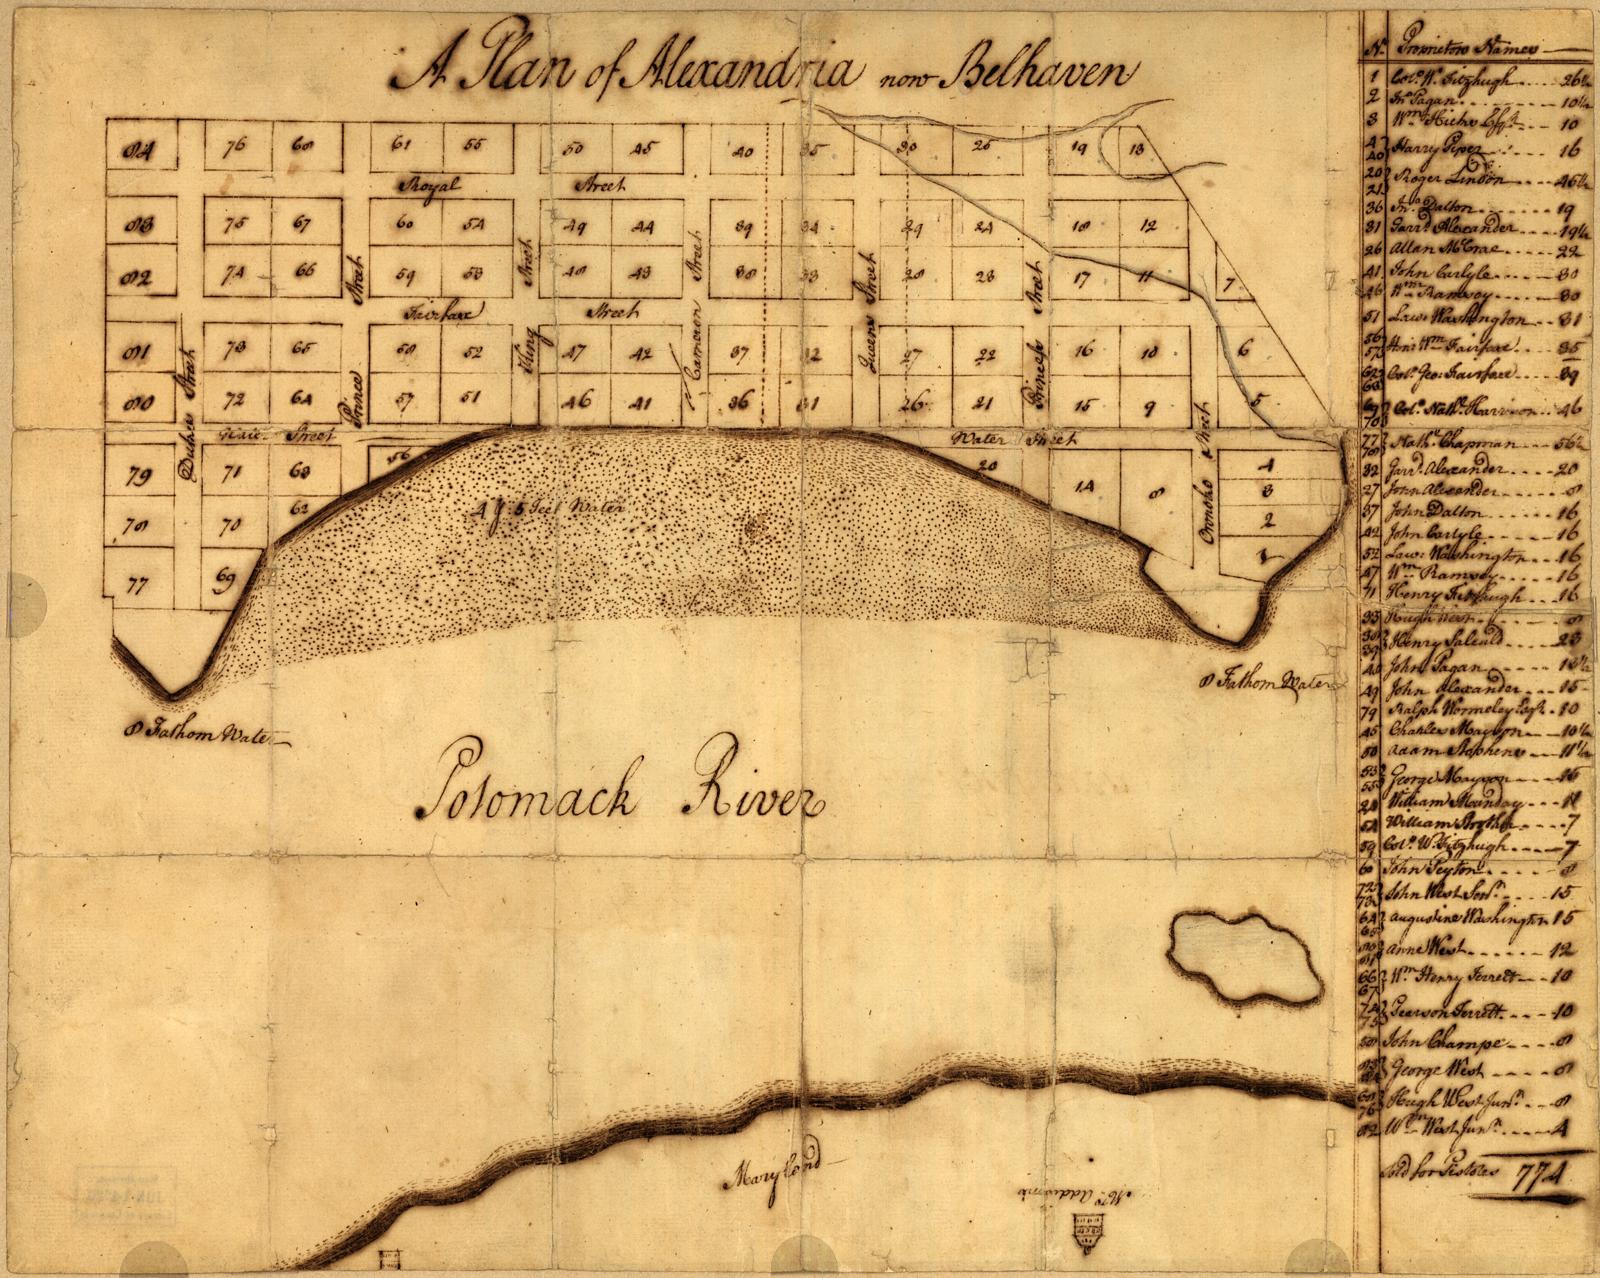
Begin with the organizing features. Numbered lots line named streets beside the Potomac. The proprietor list along the right margin acts as an index: a number in the drawing can be connected to an entry in the list. The shoreline, shallow-water stippling, and water-depth notes add a second story about the town’s relationship to navigation. They are not decorative background.
The drawing also demonstrates the limits of visual inference. A lot’s shape and number are visible, but the image alone does not supply every instrument needed to establish a modern title or boundary. The proprietor list is evidence associated with this historical plan, not a current ownership roll. To follow one parcel through time, the reader would connect its identifier with the relevant grants, deeds, later plats, and other records.
A useful discipline is to separate observation from interpretation. “Lot 26 appears next to the waterfront” is an observation about the drawing. A claim that today’s river edge is the legal boundary of a successor parcel requires much more. The intervening history of the land and water cannot be read from the old ink alone.
Second example: a township inside a published atlas
The Allin Township sheet in Geo. A. Ogle & Co.’s 1914 Standard Atlas of McLean County, Illinois uses a different framework. Its heading identifies Township 23 North, Range 7 West of the Third Principal Meridian. Those words locate a survey township within a particular rectangular survey system. “Allin” supplies the local township name, but the numerical designation provides the broader land-description address.
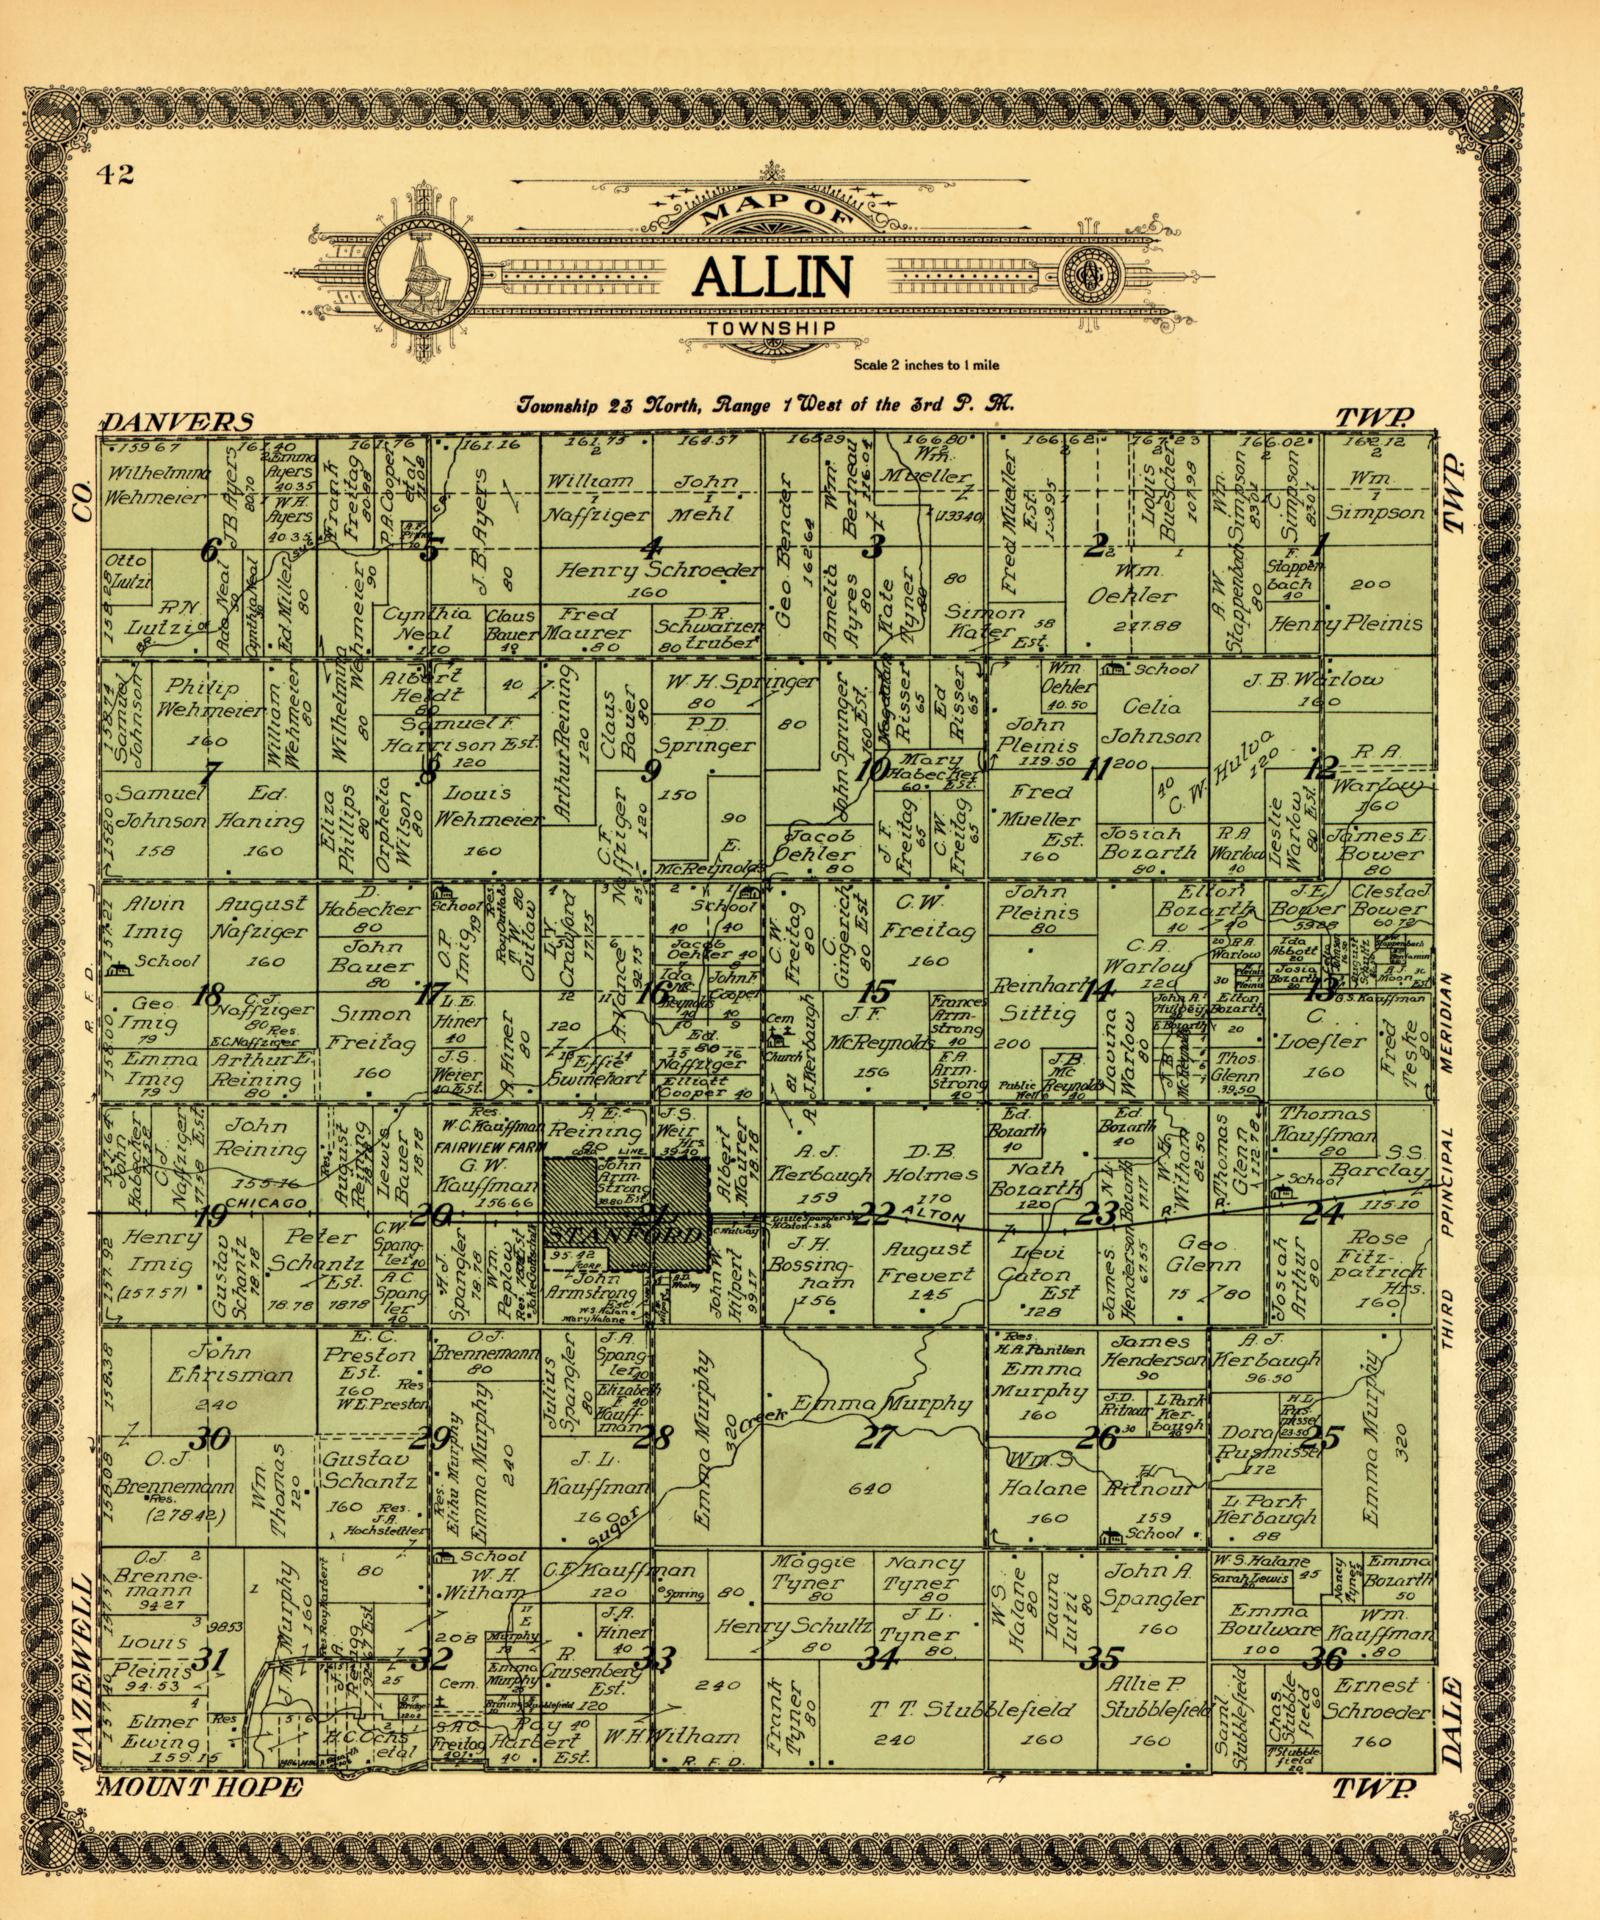
The bold section numbers form the familiar sequence: 6 through 1 across the top, then 7 through 12 in the next row, reversing direction as the numbering continues. Inside that framework are landowner names, acreages, smaller tract divisions, schools, a railroad, and the town of Stanford. The sheet contains several layers of information, created for different reasons, in one compact space.
Notice what that means for research. An owner’s name and a printed acreage can point you toward a deed search. A school symbol can lead to records of a school district or a conveyance for a school site. Neither automatically proves how the land was originally reserved or acquired. In particular, a school shown in section 16 does not, by its presence alone, establish the later ownership history of the entire original school section.
The atlas is a historical finding aid, not the original government survey. It can reveal relationships worth investigating while also containing omissions, outdated names, or compilation errors. To study the establishment of the section framework, go back to the government plat and field notes. To study a later parcel transaction, follow the county land records. Matching the source to the question is more productive than treating every line on every map as equally authoritative.
Read dimensions as a language
Old descriptions often use units unfamiliar to modern readers. A standard Gunter’s chain is 66 feet and contains 100 links, so a link is 0.66 foot. A pole, rod, or perch commonly represents 16.5 feet, or one-quarter of that chain. Eighty chains equal a mile, and ten square chains equal an acre. Confirm the units used by the particular document before converting its figures.
A hypothetical course of “N 30° E, 20 chains” illustrates the two parts of a line description. The bearing points thirty degrees eastward from the stated north reference; the distance is 1,320 feet. It does not mean an azimuth measured from east, and it does not tell us what the document meant by north. Magnetic, astronomic, grid, and assumed references must be distinguished where relevant.
Magnetic bearings deserve particular care. The direction of magnetic north changes with place and time, and instruments can also be affected by nearby magnetic material. Applying today’s declination to every course on a much older survey is therefore not a general solution. The notes, date, instructions, and relationships to established lines provide the evidence for interpreting its orientation.
For the experienced reader, closure is a useful diagnostic rather than a verdict. Reconstructing courses can reveal a transcription error, a reversed bearing, or a missing line. A mathematically closed traverse, however, can still be based on the wrong starting corner. Conversely, a small misclosure does not by itself erase the value of authentic boundary evidence.
The notes explain what the linework cannot
A plat compresses a field operation. The associated notes may identify a set stone, describe a marked tree, distinguish an existing corner from a newly established one, or record a crossing at a measured distance. These details help determine whether the neat line in the drawing was actually surveyed, adopted from earlier work, or merely protracted on paper.
Reservations, dedications, certificates, and marginal references deserve the same attention as dimensions. They can explain why a road corridor appears, where to find a related record, or whose approval the document received. The interpretation and legal effect of such language depend on the document and governing law; visual prominence is not a reliable measure of importance.
When evidence conflicts, make the conflict explicit. If a plotted course reaches one place while a monument description points elsewhere, preserve both observations and investigate their sources. Quietly rotating or stretching the drawing until it looks right can conceal exactly the discrepancy that needs explanation.
Bring an old sheet into GIS without giving it false precision
The Allin sheet states a scale of two inches to one mile. That relationship belongs to the original printed page. It does not remain physically true when the scan is resized to a laptop screen. Paper can also shrink, stretch, crease, or distort during reproduction, and thick ink lines do not define infinitely precise positions.
Georeferencing—aligning a scanned map with known locations—can help compare historical and modern geography. Its usefulness depends on the control points, the transformation, and the character of the source. A map that fits well near several road intersections may fit poorly elsewhere. Increasing the flexibility of the transformation can improve the visual overlay while hiding distortion.
Use the overlay to frame questions: Where might a former road have run? Which section contains the tract? What records should be examined next? For boundary work, numerical calls, authenticated monuments, and controlling records require their own analysis. A finely drawn digital line does not acquire the authority of evidence merely because it can be displayed at a large scale.
An old plat becomes most informative when it is read as both a picture and a document. Identify its purpose, learn its vocabulary, connect its numbered parts, and follow its references outward into other records. The result is a richer history of the landscape—and a clearer distinction between what the sheet actually tells us and what remains to be discovered.
Sources and further reading
George Washington, A Plan of Alexandria, Now Belhaven (1749), Library of Congress; Geo. A. Ogle & Co., Allin Township, in Standard Atlas of McLean County, Illinois (1914), printed page 42; the BLM’s General Land Office Records; and the Manual of Surveying Instructions (2009), particularly its treatment of field records, plats, and recovery of original survey evidence.
The field evidence behind these documents is explored in Small Mark, Big Meaning.
[…] more on the different kinds of evidence in these documents, see Reading the Old Plats and Lines Across a Young […]
[…] with The Surveyors of the Northwest for the story of the first field crews, or Reading the Old Plats for a closer look at the […]