

Maps & Mapping
The Beauty of Maps, Land Surveying and the Art of Cartography
On This Page
Maps have long been a symbol of human curiosity, exploration, and understanding of the world around us. From the earliest depictions of our surroundings etched into stone or painted onto parchment, to the sophisticated digital maps we rely on today, the art of cartography—coupled with the science of land surveying—has shaped our perceptions of space and place. Maps, far from being mere tools for navigation, are expressions of creativity, knowledge, and culture. They reflect the interplay between geography, technology, and artistry, capturing the world in ways that both inform and inspire.
The Art of Cartography: A Visual Language
Cartography is often thought of as the science of making maps, but it is also an art form. The beauty of a well-designed map lies in its ability to convey complex information through carefully considered elements like color, shape, scale, and texture. A map is more than just a guide—it’s a visual representation of a place that tells a story. It’s a record of what we know about the land, a document of history, a way of representing cultural perspectives, and sometimes even an expression of personal creativity.
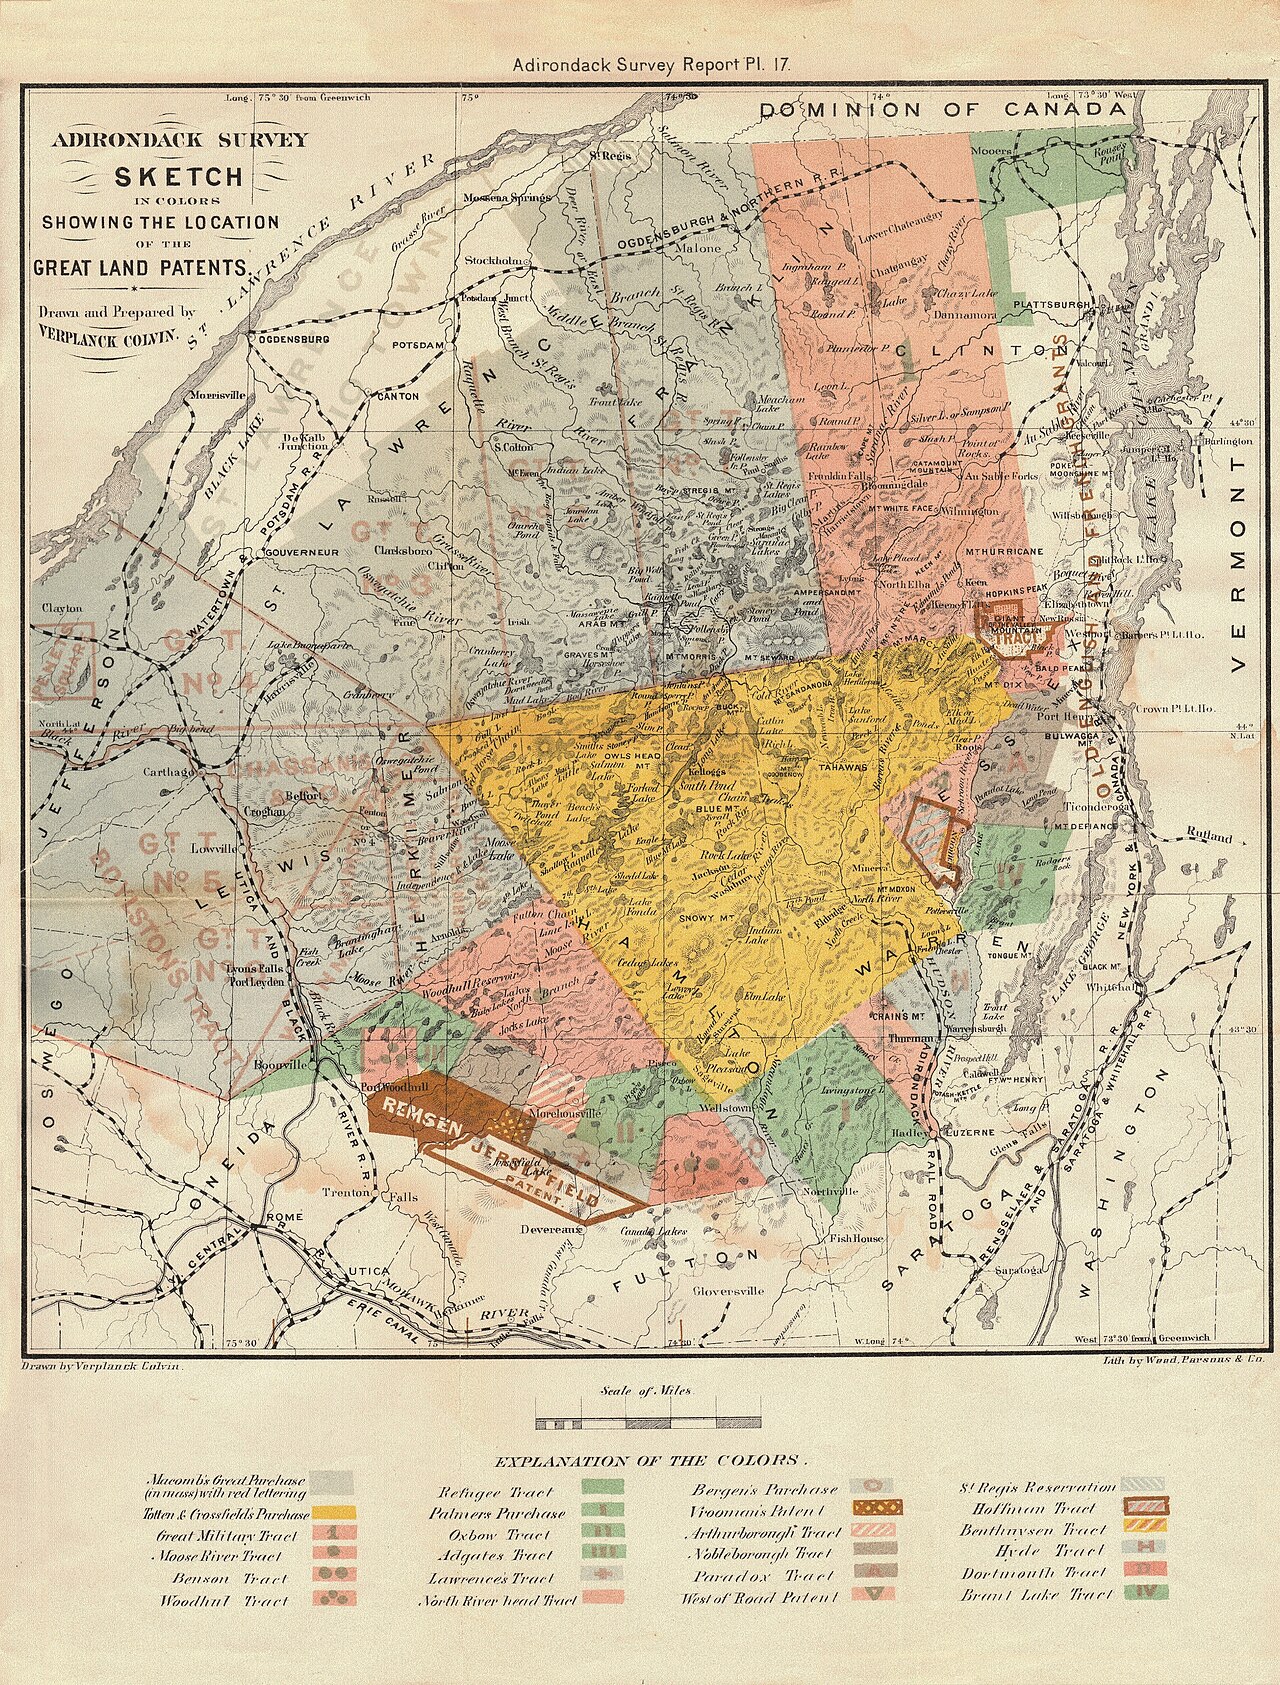
Verplanck Colvin / State of New York survey report, via Old Book Art and Wikimedia Commons. Public domain. Source. View this map in the Map Archive.

For centuries, cartographers have turned observations into visual language. The Hereford Mappa Mundi, made around 1300, places Jerusalem at the center and fills its world with cities, biblical events, animals, and classical stories. Its purpose reaches beyond locating one place in relation to another: geography becomes a setting for history and belief. Reading it as a failed road map would miss much of what makes it fascinating.
A modern topographic map invites a different kind of looking. Brown contour lines describe the folds of a hillside; blue streams gather into valleys; carefully placed names let us distinguish one ridge or settlement from the next. The sheet can be beautiful before we understand all its symbols. Learning the symbols makes it more beautiful, because the pattern begins to describe a place we could walk through.
The Science of Land Surveying: Measuring the Earth
Land surveying supplies one of mapmaking’s foundations: measured relationships between points on the ground. Maps may also draw on aerial photographs, satellite imagery, existing records, and observations collected for very different purposes. The cartographer’s task is to combine that evidence at a useful scale. The surveyor’s task includes knowing how well the measured positions are established and what they refer to.
Surveyors use instruments ranging from chains and optical telescopes to satellite receivers and laser scanners. None produces a position that is exact in an unlimited sense. Measurements carry uncertainty, and a useful survey states its reference and meets the needs of the work. A city map, a detailed construction survey, and a continental map ask different questions of the same landscape.
The creative part is not changing a measurement to make the landscape prettier. It is finding a clear way to communicate what the measurements reveal. A crowded field sketch has to become a readable drawing; an important break in slope must survive the move from ground to page. Good judgment connects the measured terrain with the map someone else can use.
A Closer Look: Reading a Hillside
A contour joins places at the same elevation. On a map with a 20-foot (6.1-meter) contour interval, the lines labeled 100, 120, and 140 feet mark successive levels, not three separate trails. Where the lines crowd together, the same rise occurs over less horizontal ground: the hillside is steeper. Wider spacing indicates a gentler slope. Check the map’s stated contour interval; it should never be guessed from how dramatic the hill looks.
Scale adds another layer of meaning. On a 1:24,000 map, 1 inch represents 2,000 feet (about 610 meters) on the ground. A half-inch gap between two features therefore represents about 1,000 feet (305 meters) horizontally. That tells us nothing by itself about the walking distance over a steep slope. The USGS symbol guide explains how contours, symbols, and names work together on its topographic sheets.
The Intersection of Art and Science
What makes maps so captivating is the way they blend science and art. They are products of careful measurements, data collection, and analysis, yet their final form is often one of elegance and visual harmony. This balance between precision and creativity is what has allowed cartography to evolve into both a scientific discipline and a medium for artistic expression.
One of the most striking examples of this intersection is the thematic map: a map organized around a subject rather than a general inventory of features. A temperature map may use a sequence of colors to show warmer and cooler areas. A population-density map can reveal a pattern that raw counts would obscure. Here beauty and honesty are closely connected. The colors, intervals, and legend need to explain the data without suggesting a sharp boundary where the change is gradual.
Even digital maps, such as those used in navigation apps or online mapping services, reflect the beauty of cartography. While they may not be hand-drawn or adorned with ornate decorations, the simplicity and user-friendly design of these maps reveal the cartographer’s skill in organizing information and presenting it in an easily digestible form. The minimalist lines and icons found in digital maps are also part of the aesthetic appeal, emphasizing clarity and utility.
Maps as Cultural Artifacts
Maps are also powerful cultural artifacts. The choice of names, the prominence of a capital, and the drawing of a boundary tell us what the maker considered important. Hereford’s placement of Jerusalem is an especially visible example. Other choices are quieter: which roads are named, which settlements fit on the sheet, and which histories receive no symbol at all. A useful question to bring to any map is, “What was this made to help someone see?”
Digital maps make those choices easier to change, but they do not make them disappear. Zooming in brings minor roads and additional place names into view; zooming out removes them so the larger pattern remains readable. A geographic information system, or GIS, can hold many layers of information, while the displayed map shows a selection. The screen is still a designed view of the world.
The Enduring Appeal of Maps
A map gives us the pleasure of recognition and the invitation of an unfamiliar place. A bend in a river becomes a landmark; a cluster of contours suggests a climb; an old name opens a question about who lived there. That is where surveying and cartography meet most gracefully: careful measurement gives the imagination somewhere trustworthy to go.
Sources and Further Reading
Hereford Cathedral: The Mappa Mundi
Verplanck Colvin’s Adirondack survey sketch: image record and rights
Discussion
Questions, field experience, and thoughtful observations are welcome.