Global Surveying
Surveying Beneath Ice: Mapping Continents Hidden From View
Airborne radar, satellite altimetry, GNSS, gravity, and decades of field surveys reveal the mountains, canyons, lakes, and basins concealed beneath continental ice.
On This Page
- 01 — Introduction
- 02 — A Continent With Its Landscape Concealed
- 03 — Three Surfaces Instead of One
- 04 — Radar Echoes From the Bed
- 05 — Internal Layers Are Part of the Record
- 06 — The Role of GNSS and Aircraft Navigation
- 07 — Measuring the Ice Surface From Space
- 08 — Gravity and Magnetics Fill the Spaces Between Lines
- 09 — Bedmap3 and Six Decades of Surveying
- 10 — Why Bed Shape Controls Ice Behaviour
- 11 — A Map With Uneven Certainty
- 12 — Surveying a Landscape No One Can Stand On
- 13 — Sources and Further Reading
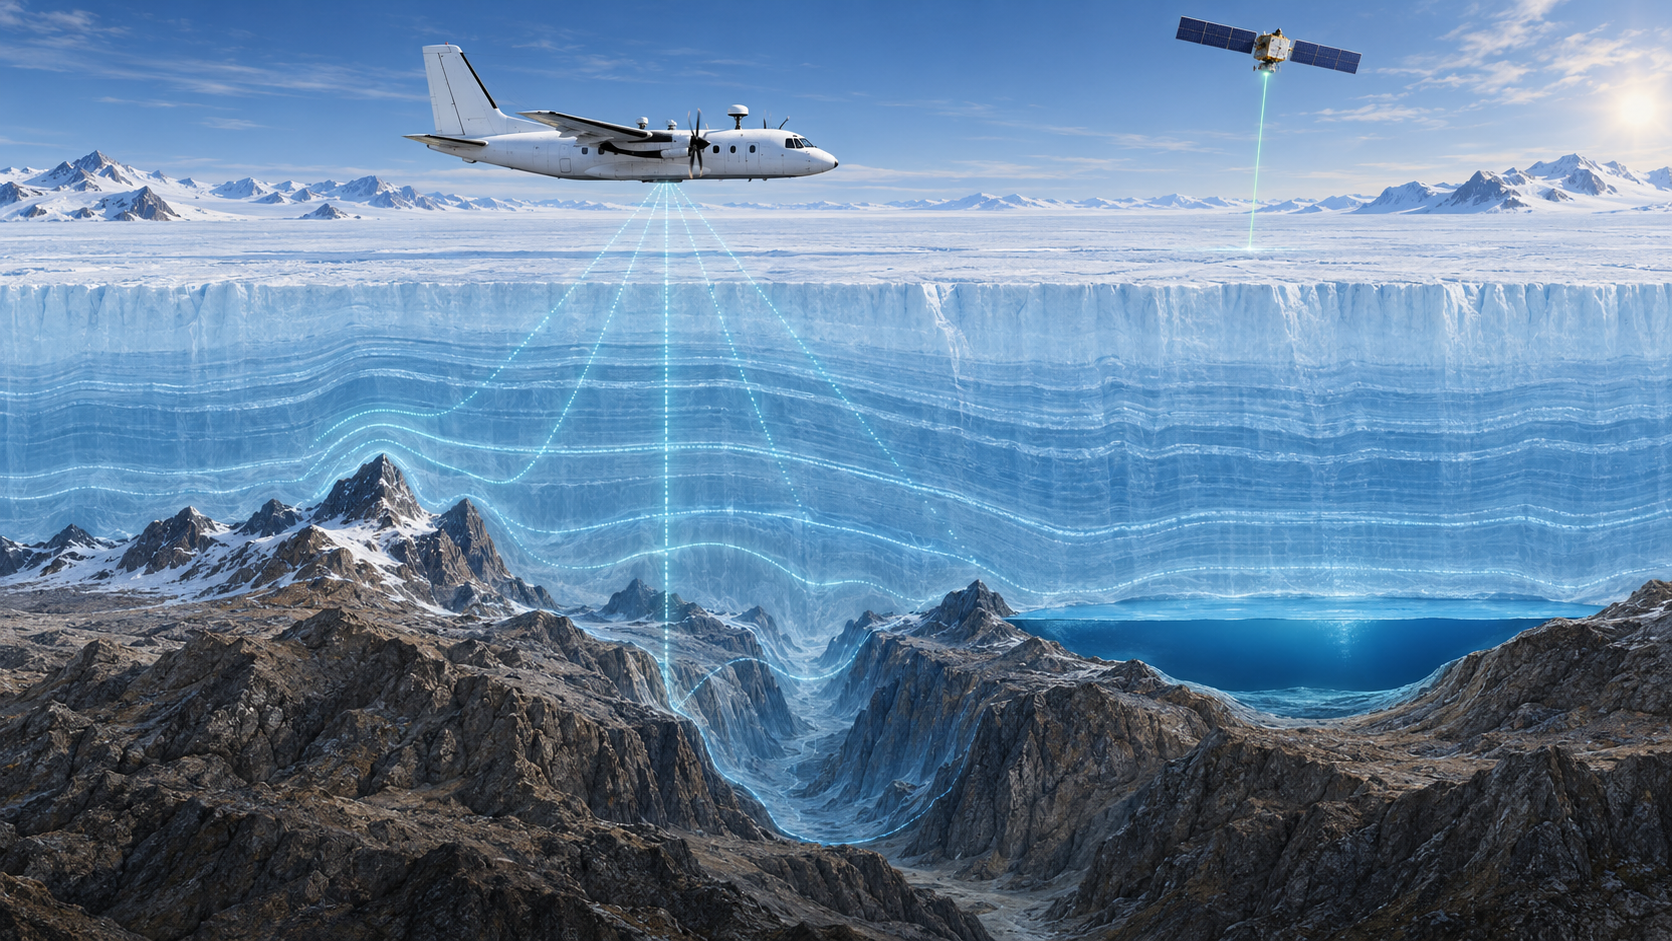
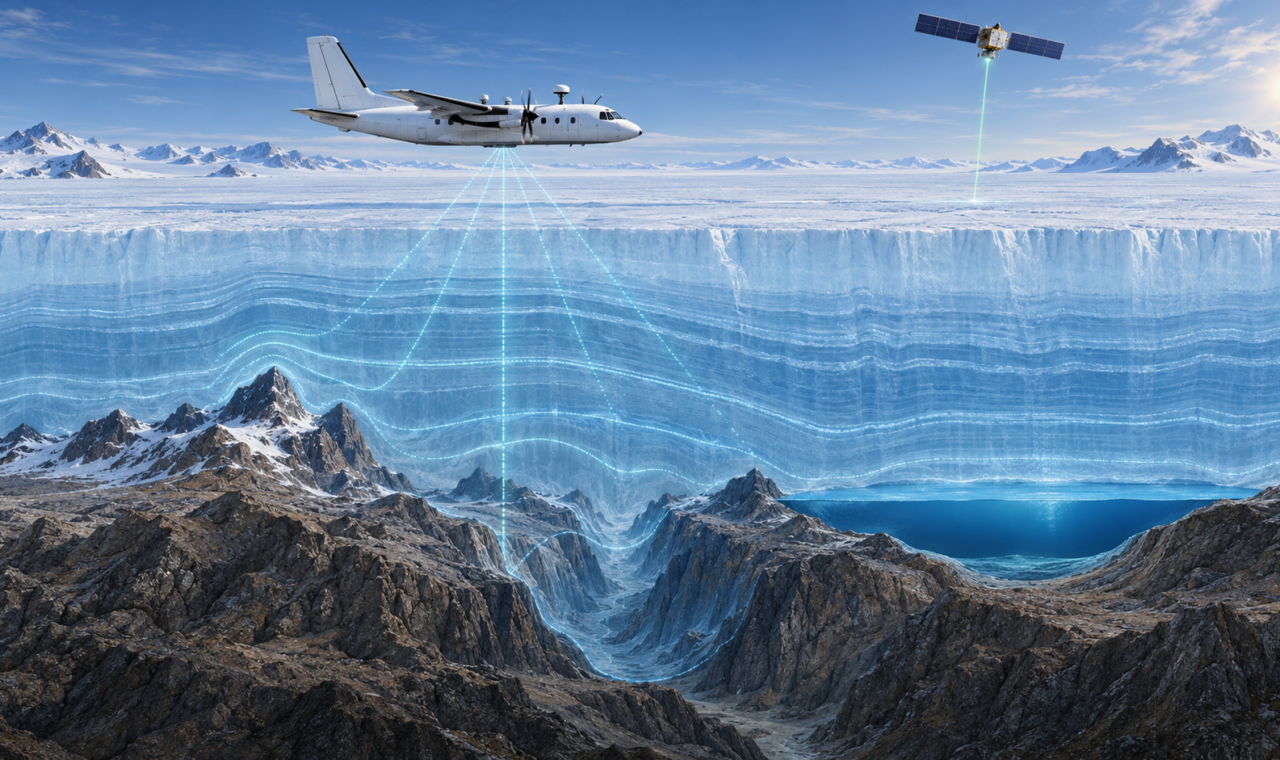
Original conceptual illustration created for The Lost Surveyor; the hidden landscape combines representative features and is not a surveyed profile.
A Continent With Its Landscape Concealed
Most topographic surveying begins with a visible surface. Antarctica reverses the problem. The ice sheet is the surface an aircraft or satellite can observe, but the continent’s mountains, valleys, basins, and plains lie beneath ice that is kilometres thick in places.
Mapping that hidden bed is not an exercise in completing an atlas. Bedrock topography influences how ice flows, where it is grounded, how water moves beneath it, and how the ice sheet may respond as the ocean and atmosphere change. A deep trough can guide fast-flowing ice toward the coast. A ridge can slow or redirect it. A basin below sea level can allow ocean-driven retreat to progress far inland.
No single instrument can describe the entire system. Polar geomatics combines satellite altimetry, airborne radar, GNSS, gravimetry, magnetics, seismic observations, bathymetry, and decades of field records to map surfaces that cannot all be seen at once.
Three Surfaces Instead of One
An ice-sheet map must distinguish at least three important surfaces: the upper surface of the ice, the bed beneath it, and the thickness obtained from the difference. Along the coast, the problem also includes the seafloor under floating ice shelves and the grounding line where ice changes from resting on bedrock to floating.
The upper surface can be measured from space with laser or radar altimetry and from aircraft using laser scanners. The bed is much harder. Visible and near-infrared light cannot pass through the ice sheet, so researchers use lower-frequency radar capable of penetrating ice and reflecting from internal layers and the boundary below.
Every measurement must be georeferenced. Aircraft position and attitude, radar timing, antenna geometry, surface elevation, firn conditions, and the electromagnetic properties of ice all contribute to the final bed elevation.
Radar Echoes From the Bed
An ice-penetrating radar transmits radio energy downward. Part of the signal reflects from layers within the ice, and part may reach the bed. The travel time of the echo, combined with an estimate of wave speed through ice, provides a measure of thickness.
The measurement resembles sonar in concept but uses electromagnetic waves rather than sound. Ice is sufficiently transparent at selected radar frequencies for the signal to travel through great thicknesses under favourable conditions. Liquid water, rough bedrock, warm ice, complex layering, and signal attenuation can change the character of the return.
A strong, smooth reflection may indicate water beneath the ice, but interpretation requires care. Radar brightness alone does not prove that a feature is a lake. Researchers compare reflection strength, geometry, hydraulic setting, repeated tracks, and other observations before assigning a geophysical meaning.
Internal Layers Are Part of the Record
Radar profiles frequently reveal internal layers created by changes in snow accumulation, chemistry, volcanic fallout, ice crystal orientation, and deformation. Where layers can be traced across a region, they provide evidence about how the ice has flowed and accumulated through time.
The layers are not ordinary geologic strata. They have been folded, stretched, buried, and carried by a moving material. Their shape can identify disturbed flow, preserve chronological horizons, and help connect ice-core records with the wider sheet.
For mapping the bed, internal layers can also be a source of complexity. Multiple reflections and steep geometry may obscure the desired echo. Processing must separate the bed return from a vertical stack of other signals.
The Role of GNSS and Aircraft Navigation
An airborne radar profile has little cartographic value without a reliable trajectory. GNSS records the aircraft’s position, while an inertial system measures roll, pitch, and heading. Antenna offsets and timing are calibrated so each radar trace can be assigned to the correct location and elevation.
Flying a line over featureless ice sounds simple, but wind, weather, fuel, terrain clearance, magnetic conditions, and limited bases shape the survey design. Crews must balance broad coverage with closely spaced lines in areas where narrow valleys, grounding zones, or complex mountains require more detail.
Crossing flight lines provide checks and help reveal offsets among campaigns. Because continental products combine data collected by different nations, instruments, and decades, consistent reference frames and metadata are essential.
Measuring the Ice Surface From Space
Satellite altimetry tracks the upper surface rather than looking through the entire ice column. NASA’s ICESat-2 mission uses its Advanced Topographic Laser Altimeter System, or ATLAS, to measure elevation along six ground tracks. Repeated observations reveal surface-height change and contribute to estimates of ice mass loss.
Laser altimetry provides dense, precise measurements along its tracks but can be affected by clouds and surface scattering. Radar altimeters use a different part of the electromagnetic spectrum and interact differently with snow and firn. Airborne laser surveys, ground GNSS, and crossover analysis help validate and connect the observations.
NASA’s Operation IceBridge flew airborne campaigns between the first ICESat mission and ICESat-2. Its instruments measured surface elevation, ice thickness, internal structure, gravity, and other properties, preserving continuity while also supplying detail that a single satellite instrument could not.
Gravity and Magnetics Fill the Spaces Between Lines
Radar does not return a clear bed echo everywhere. Deep, warm, rough, or highly attenuating ice can create gaps. Aircraft therefore carry gravimeters and magnetometers in addition to radar and laser systems.
Gravity observations respond to differences in mass among ice, rock, water, sediment, and seawater. They can help estimate the shape of broad basins or the seafloor beneath floating ice where direct sounding is sparse. Magnetic observations reveal contrasts in the crust and support geological interpretation.
These methods have coarser or more indirect relationships to topography than a clear radar range. They constrain what can reasonably exist between surveyed profiles. The final map is therefore a combination of direct observations and modelled interpolation, with uncertainty that varies across the continent.
Bedmap3 and Six Decades of Surveying
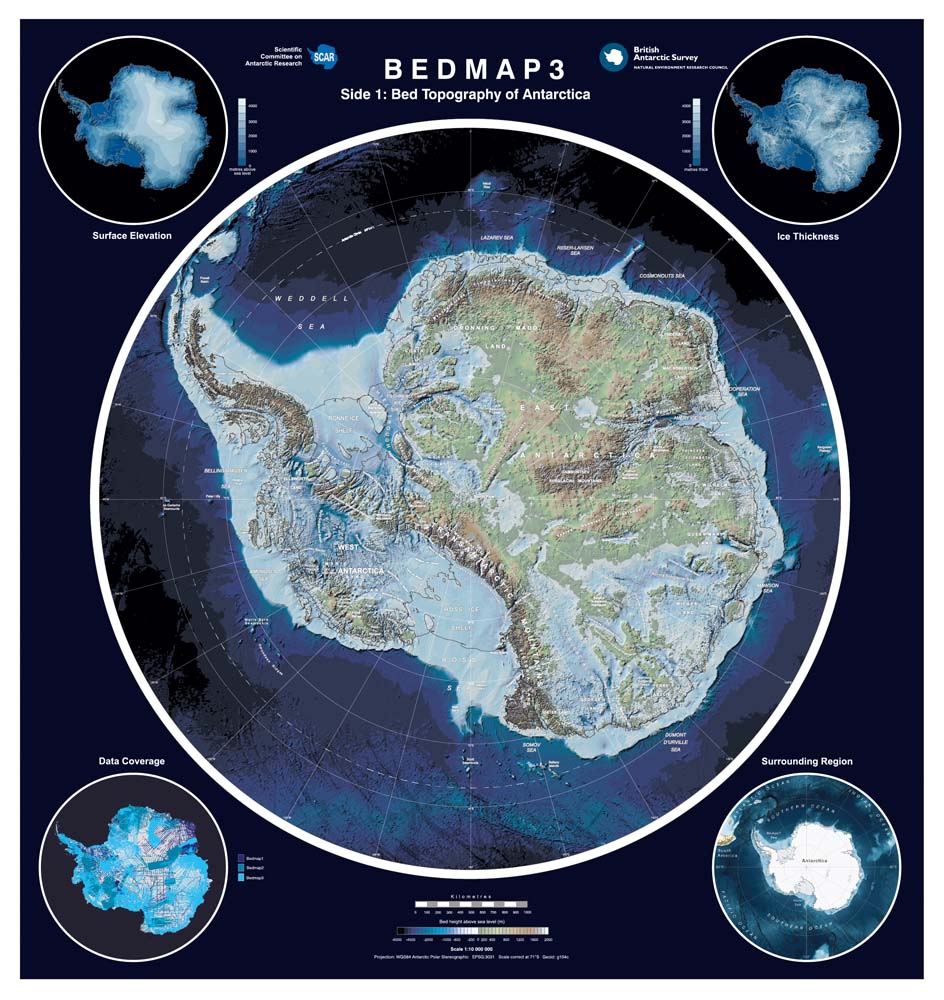
Credit: British Antarctic Survey (2024), Bedmap3, Sheet 3A, Edition 1; Open Government Licence 3.0.
In 2025, an international team led by the British Antarctic Survey released Bedmap3, the most detailed continent-wide compilation yet of Antarctic ice surface, thickness, bed elevation, and related boundaries. The project incorporates more than six decades of measurements gathered by aircraft, satellites, ships, ground parties, and earlier traverses.
According to the project description, Bedmap3 added 84 aerogeophysical surveys, 52 million data points, and 1.9 million line-kilometres of measurement beyond the datasets used for its predecessor. The new compilation filled gaps in mountain ranges, the East Antarctic interior, coastal West Antarctica, and the Antarctic Peninsula.
One revision moved the known location of Antarctica’s thickest overlying ice to an unnamed canyon in Wilkes Land, where the mapped thickness reaches 4,757 metres. The change illustrates an important property of continental mapping: a familiar extreme can move when older measurements are reinterpreted and previously sparse regions receive better coverage.
Why Bed Shape Controls Ice Behaviour
Ice flows under its own weight. Surface slope supplies much of the driving stress, while bed slope, roughness, temperature, water pressure, and sediment influence resistance. A hidden mountain range can divide flow; a smooth, wet bed can support rapid ice streams.
Topography below sea level is especially important near marine margins. If the bed deepens inland, a retreating grounding line may expose thicker ice to flotation and create conditions that favour further retreat. Models need accurate bed geometry to determine where those feedbacks are possible.
Subglacial water adds another network. Lakes and channels can store or move water beneath the ice, changing basal pressure and motion. Their routes are governed partly by bed elevation and partly by pressure from the overlying ice, so drainage does not always follow bedrock valleys in the way a surface river would.
A Map With Uneven Certainty
A continental grid can appear complete even where flight lines are far apart. That visual completeness should not be confused with uniform observation density. Some regions are crossed repeatedly at close spacing; others rely on long interpolation between sparse measurements.
Modern compilations include data coverage and uncertainty products so users can distinguish a well-observed valley from a modelled one. New surveys often target places where model sensitivity is high and existing uncertainty is large rather than simply filling the map with equally spaced lines.
This is a principle familiar in all surveying. A surface model is not only a set of elevations. It is also a record of where measurements were made, how they were reduced, and how much confidence belongs between them.
Surveying a Landscape No One Can Stand On
The bed beneath Antarctica cannot be occupied as an ordinary ground surface while kilometres of ice cover it. Even so, its coordinates emerge from recognizable geomatic operations: measure a platform trajectory, calibrate sensors, observe ranges and fields, reconcile crossing lines, transform datums, combine campaigns, interpolate gaps, and publish uncertainty.
The unusual part is the chain of inference between aircraft and rock. A radar echo may pass through ancient layers before reflecting from the bed. A gravity anomaly may constrain a basin never directly sounded. A laser pulse from orbit may measure surface change that is then combined with thickness and density to estimate mass loss.
Together, these observations turn an apparently featureless ice surface into a layered map of the continent below. The mountains and canyons were always there. Geomatics makes them available to science without removing the ice.
Sources and Further Reading
British Antarctic Survey: New Map of the Landscape Beneath Antarctica
British Antarctic Survey: Bedmap3 Dataset and Publication
NASA Goddard Space Flight Center: ICESat-2 Science
NASA Sea Level Change Portal: Operation IceBridge
National Snow and Ice Data Center: Greenland Ice Thickness and Bedrock Elevation Data Guide