Instruments & Methods
Reading Motion in Radar Fringes: How InSAR Maps a Changing Ground
By comparing the phase of repeated radar observations, InSAR can reveal earthquake deformation, volcanic inflation, subsidence, and other surface motion across entire regions.
On This Page
- 01 — Introduction
- 02 — A Map Made From the Difference Between Two Images
- 03 — Synthetic Aperture Radar Without the Interferometry
- 04 — How Interference Becomes a Deformation Pattern
- 05 — One Direction at a Time
- 06 — Earthquakes Written Across a Landscape
- 07 — Volcanoes, Aquifers, and Slow Subsidence
- 08 — Why an Interferogram Can Lose the Ground
- 09 — From Pairs of Images to Time Series
- 10 — Where Ground Surveying Fits
- 11 — A Measurement Hidden in Colour
- 12 — Sources and Further Reading
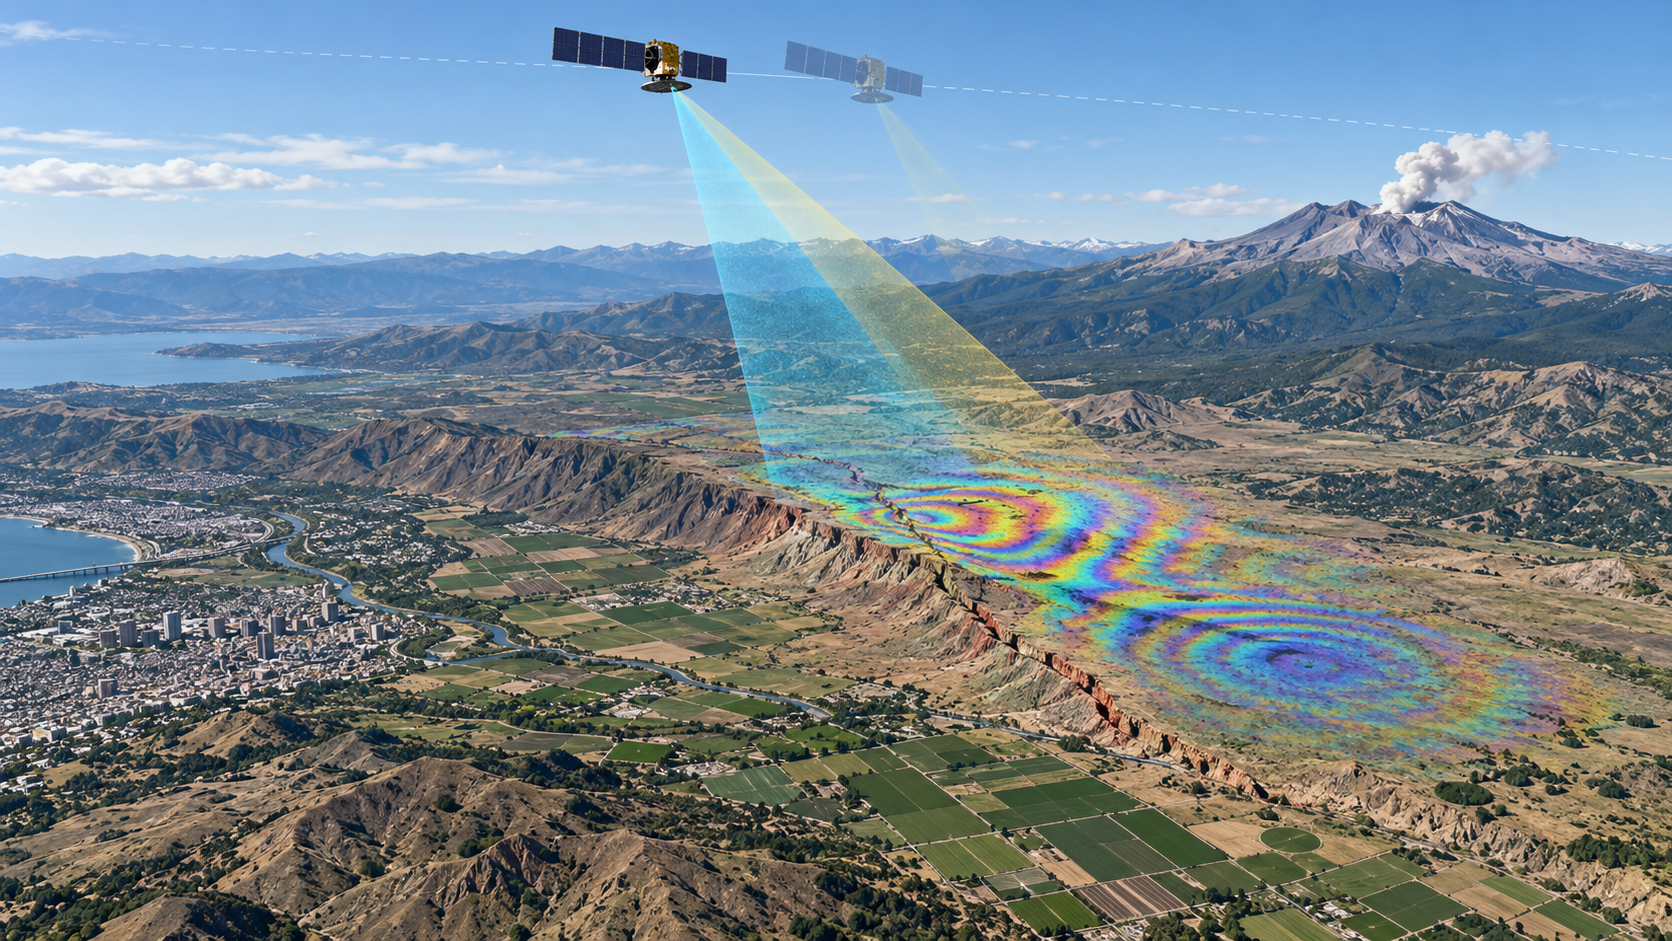
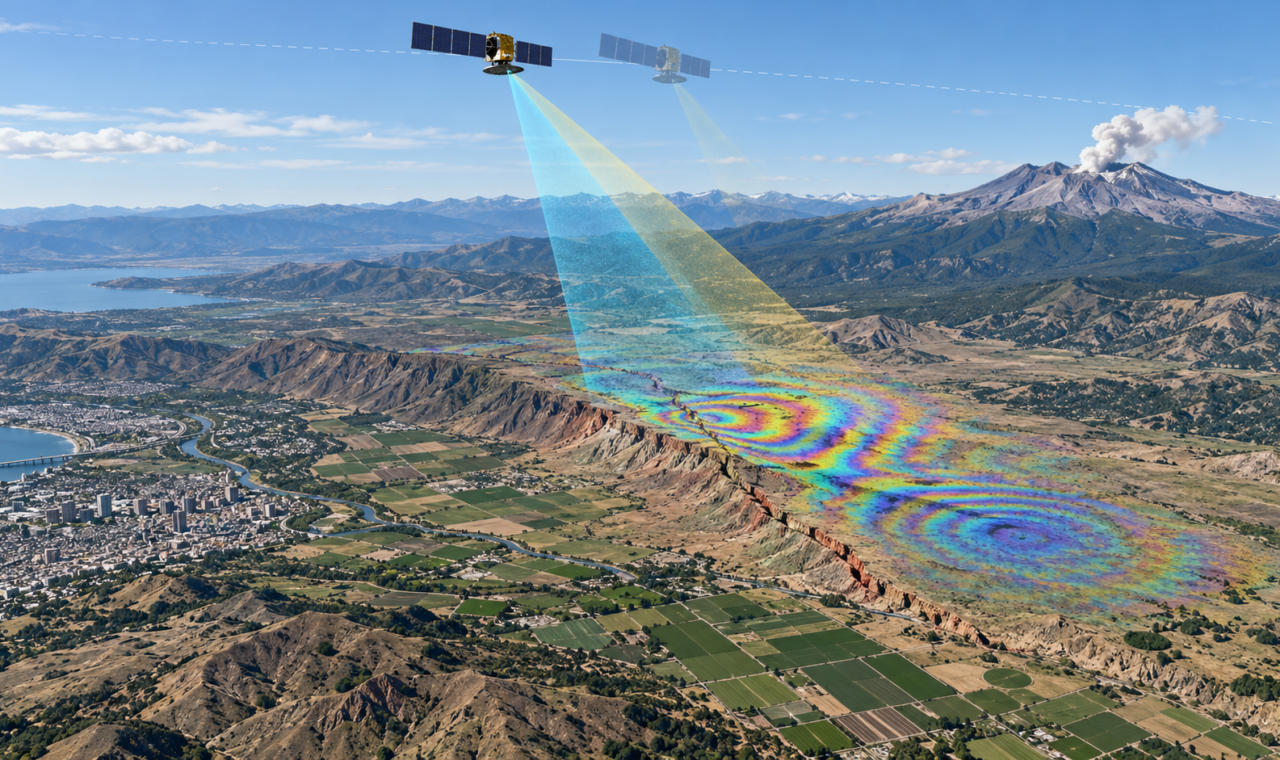
Original conceptual illustration created for The Lost Surveyor; not an actual interferogram or measured deformation map.
A Map Made From the Difference Between Two Images
A conventional satellite image records brightness. An interferometric synthetic aperture radar measurement preserves something less visible but more sensitive: the phase of the returned radar signal. When a satellite observes the same terrain from nearly the same orbit at two different times, the phase difference can reveal a change in the distance between the ground and the spacecraft.
The technique is known as InSAR, for interferometric synthetic aperture radar. It can map deformation across hundreds or thousands of square kilometres without placing a receiver at every point. Earthquake rupture, volcanic inflation, groundwater-related subsidence, mining, landslides, and the slow motion of ice can all produce signals visible in radar interferometry.
Its reach is impressive, but the measurement is not a direct three-dimensional survey of everything that moved. InSAR observes change along the radar line of sight. Understanding what the coloured patterns mean requires geometry, repeated observations, and careful separation of ground motion from the atmosphere and the surface itself.
Synthetic Aperture Radar Without the Interferometry
A radar satellite transmits microwave pulses and records the energy reflected from Earth. Because the spacecraft moves along its orbit, processing can combine returns collected from many positions to create the effect of a much larger antenna. This synthetic aperture produces finer spatial detail than the physical antenna alone would provide.
Radar is an active sensor. It supplies its own illumination and can operate day or night. Many radar wavelengths also pass through clouds, making the technique valuable where optical imagery is frequently obscured. The strength of the return depends on surface roughness, moisture, viewing geometry, wavelength, and polarization.
Those amplitude measurements create useful radar images, but InSAR adds phase. Phase records where the returning wave lies within its cycle. A small change in travel distance shifts that phase, allowing a radar wavelength measured in centimetres to sense surface displacement at a fraction of the wavelength under favourable conditions.
How Interference Becomes a Deformation Pattern
Two complex radar images are aligned so that corresponding pixels represent the same ground. Their phases are compared to produce an interferogram. Some of the phase difference comes from terrain and viewing geometry; some may come from movement between the acquisition dates.
The familiar coloured fringes are a visualization of wrapped phase. After the phase advances through a full cycle, the colours repeat. Each complete fringe represents a particular change in radar path length determined by the sensor wavelength and processing convention.
Fringes close together indicate a rapid spatial change in line-of-sight displacement. Broad, widely spaced colours indicate a gentler gradient. A bull’s-eye pattern may accompany volcanic uplift or subsidence, while an earthquake can produce sharp and asymmetric patterns around a fault. The colours do not represent ordinary surface colour or elevation.
One Direction at a Time
An interferogram measures whether the ground moved toward or away from the satellite along its viewing direction. Horizontal motion across the radar’s line of sight may be visible, while motion parallel to the flight direction can be poorly resolved. Vertical and east-west displacement often project strongly into the observation; north-south motion is commonly more difficult for near-polar satellite orbits.
Researchers combine ascending and descending passes, GNSS observations, fault models, or other measurements to separate components of motion. Even then, the result depends on assumptions and data coverage. Calling an interferogram a displacement map is convenient, but a complete interpretation should state the line-of-sight geometry.
This is familiar surveying logic. A precise distance constrains position along one direction. Additional geometry is needed to recover a full vector.
Earthquakes Written Across a Landscape
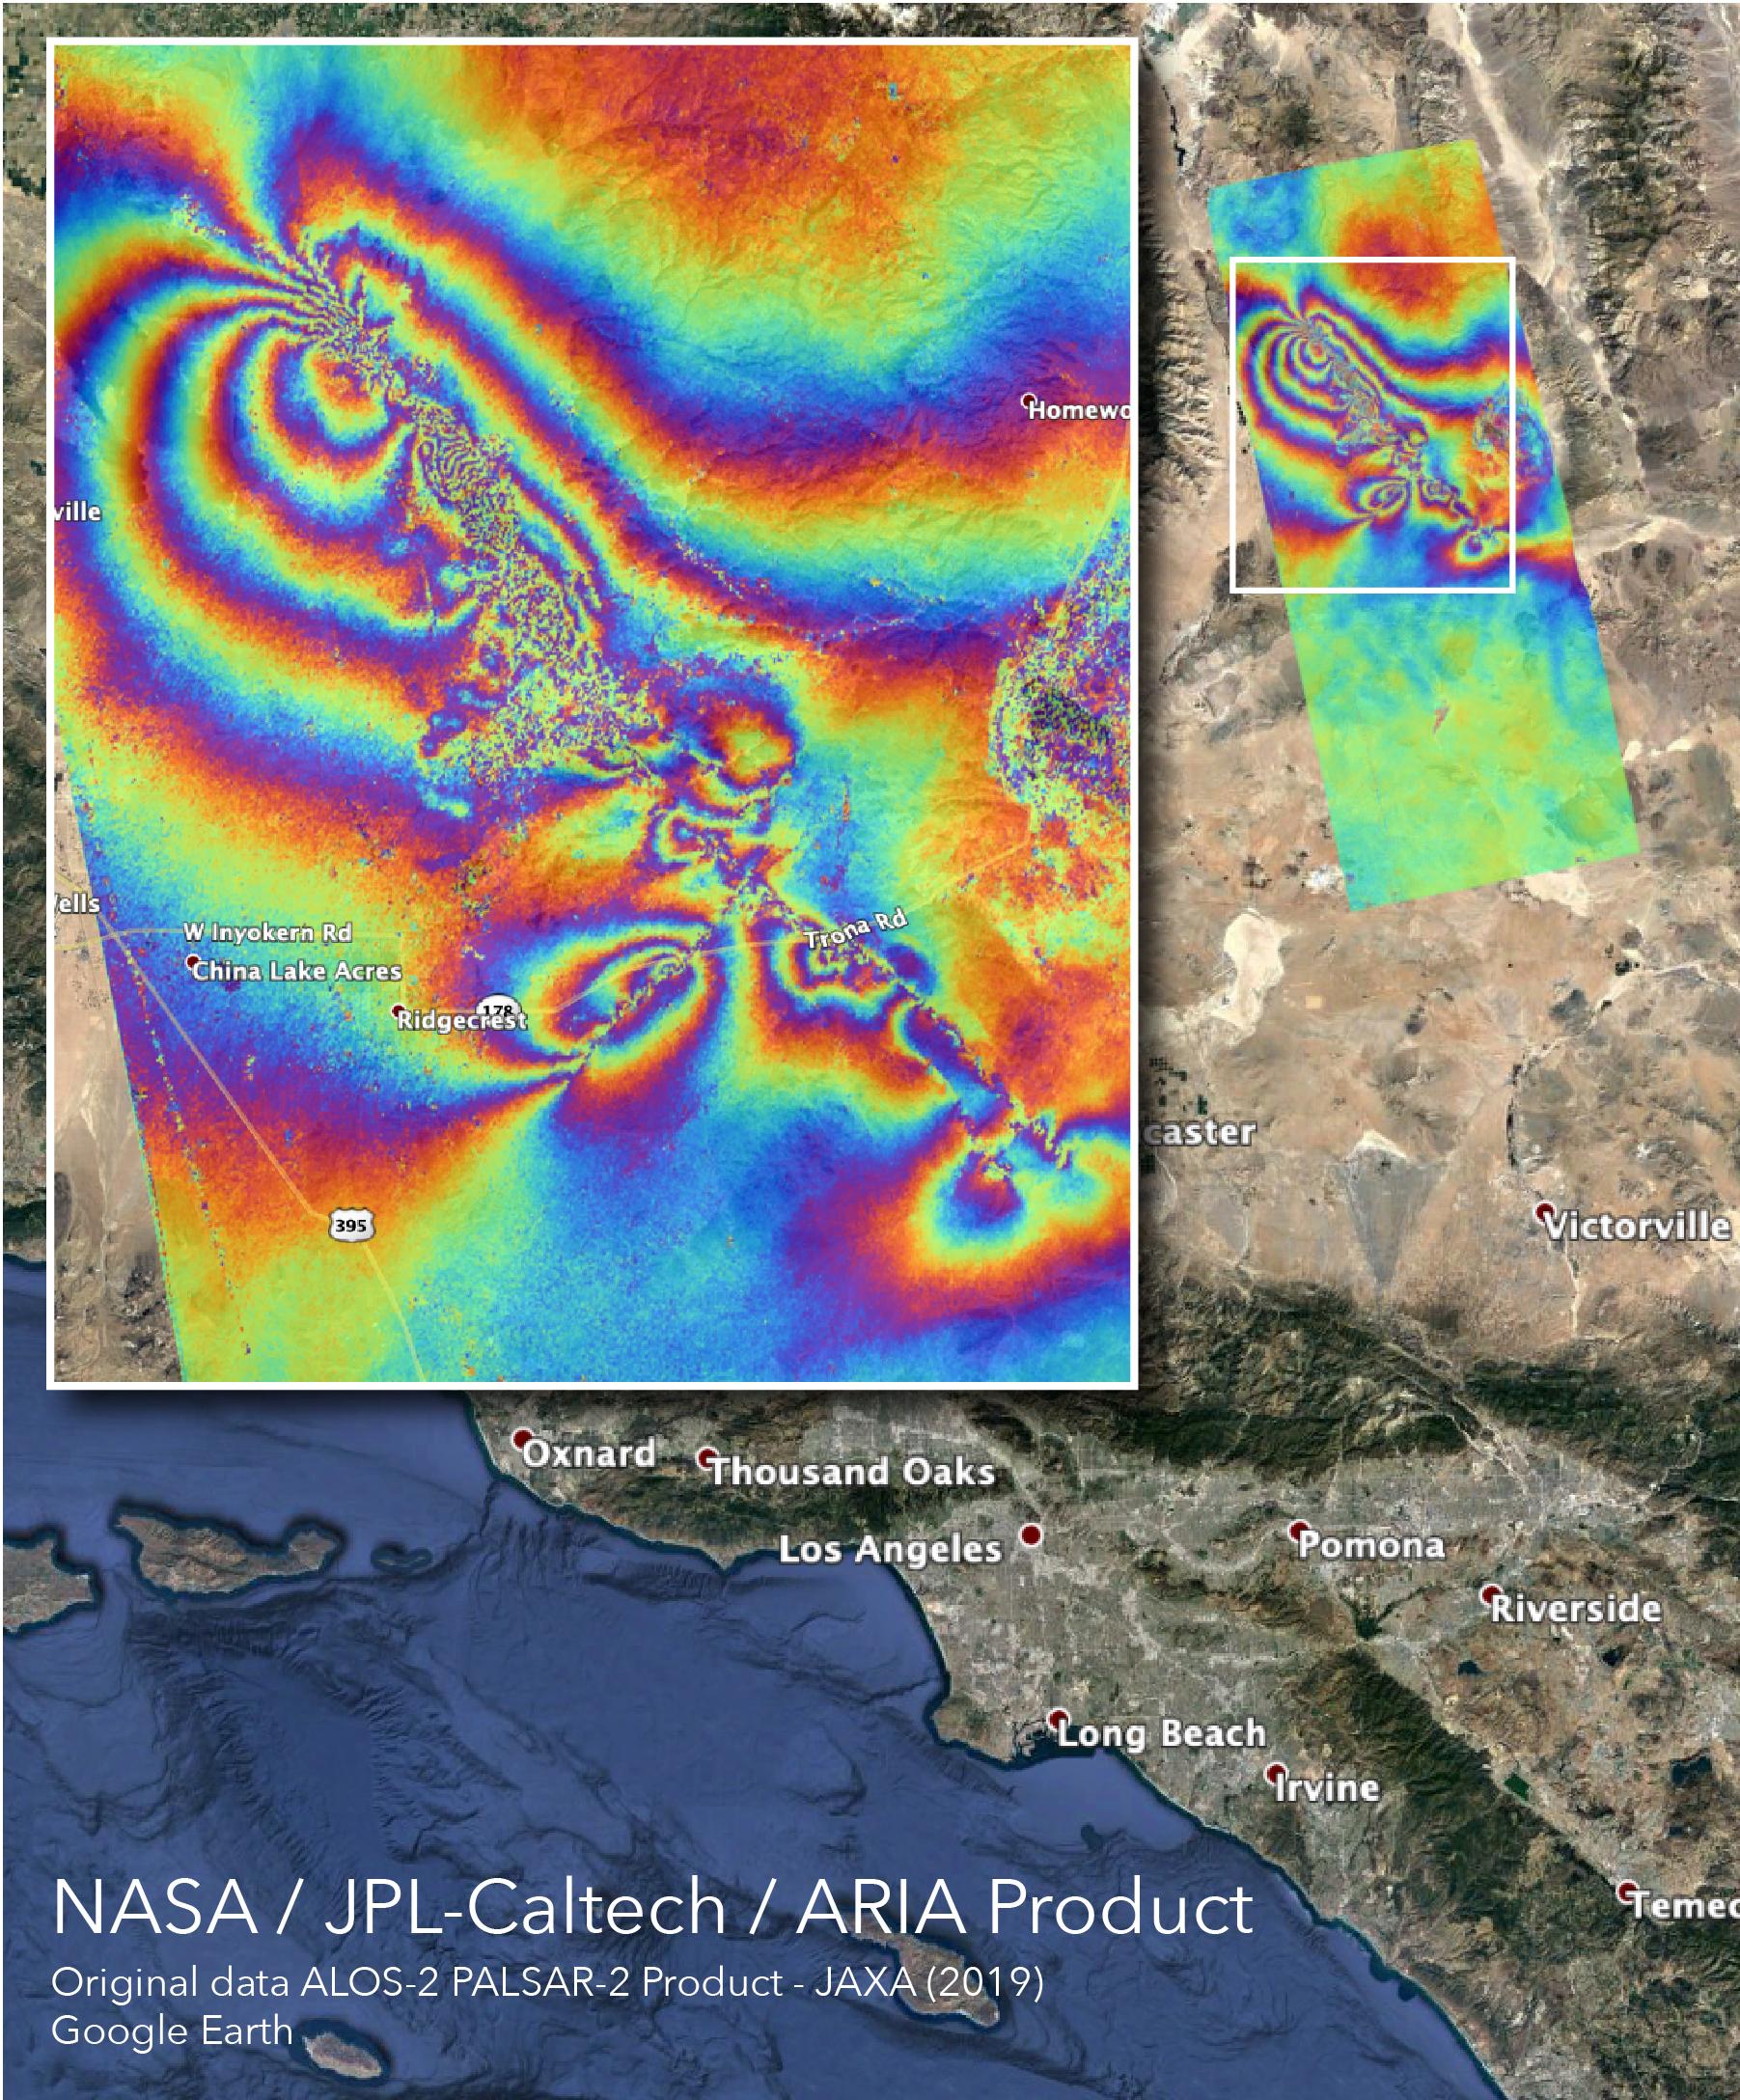
Credit: NASA/JPL-Caltech; ALOS-2 data provided by JAXA.
Earthquakes can produce some of the clearest InSAR signals because the ground changes suddenly between two satellite passes. Radar observations after the 2014 South Napa earthquake, for example, were used with GNSS to map deformation and help model the fault movement.
The spatial coverage reveals details that a sparse ground network might miss: the width of the deforming zone, variations along the fault, and regions of distributed motion. InSAR does not replace field investigation. Surface rupture mapping, control surveys, GNSS, seismology, and geological evidence remain necessary to understand what happened on and below the ground.
The radar map is especially valuable during the early response, when investigators need a regional view. It can direct attention toward the areas of greatest deformation even where roads or communications are disrupted.
Volcanoes, Aquifers, and Slow Subsidence
Not all deformation arrives in a single event. Magma moving beneath a volcano can inflate or deflate the surface over months or years. The United States Geological Survey uses ground deformation, including InSAR and GNSS, as part of volcano monitoring. A detected change may indicate magma or fluid movement, but it does not guarantee an eruption.
Groundwater withdrawal can compact aquifer systems and cause broad subsidence. In California’s Central Valley, radar interferometry has mapped uneven sinking associated with water use. The pattern matters to canals, levees, roads, pipelines, drainage, and flood management because differential motion can be more damaging than uniform settlement.
Mining, hydrocarbon extraction, tunnelling, permafrost thaw, and landslides create other applications. InSAR is strongest when it is treated as repeated regional evidence, supported by observations that can identify the mechanism and verify the scale of movement.
Why an Interferogram Can Lose the Ground
Interferometry requires the radar returns from two dates to remain coherent. Bare rock, buildings, and dry terrain often preserve a stable scattering pattern. Vegetation may change between passes as leaves, branches, moisture, or wind alter the radar response. Snow, cultivation, flooding, and construction can also reduce coherence.
The atmosphere adds another difficulty. Water vapour and pressure variations change the radar signal’s travel time, creating phase patterns that can resemble ground deformation. Orbital uncertainty and errors in the terrain model can introduce additional signals. Time-series analysis, weather information, multiple viewing dates, and ground control help separate these effects.
Wrapped phase must also be unwrapped to create a continuous displacement field. If deformation is too steep, coherence is poor, or the data contain gaps, phase unwrapping can choose the wrong number of cycles. A visually smooth result is not proof that every fringe has been interpreted correctly.
From Pairs of Images to Time Series
Early demonstrations often compared one image before an event with one image after it. Modern analysis can combine long sequences of acquisitions. A time series reduces the influence of individual atmospheric disturbances and shows whether motion is steady, seasonal, episodic, or accelerating.
Repeated missions have made that approach increasingly practical. The European Sentinel-1 satellites established systematic radar coverage for many regions. The NASA-ISRO Synthetic Aperture Radar mission, NISAR, launched in July 2025 and entered science operations in early 2026. Its L-band and S-band instruments are designed to observe changes across land and ice with open data products.
Longer radar wavelengths such as L-band can maintain coherence better through some vegetation than shorter wavelengths, although no band solves every surface condition. More frequent acquisitions improve the chance of capturing rapid events and reduce the amount of change that must be connected between observations.
Where Ground Surveying Fits
InSAR offers dense spatial coverage but measures in a satellite line of sight and relative to reference areas chosen during processing. GNSS and conventional surveys provide direct observations at discrete monuments, local three-dimensional control, and independent checks on long-term stability.
The strongest investigations combine them. A radar time series can reveal where movement is occurring and how far it extends. Ground observations can establish the motion of selected points, confirm the reference, and support engineering decisions at a site.
For surveyors, the important lesson is not that a satellite has replaced the crew. It is that deformation can now be observed as both a network of precise points and a continuous regional pattern. Each view answers questions the other cannot.
A Measurement Hidden in Colour
An interferogram is visually striking, but its colours are the final expression of a precise comparison between electromagnetic waves acquired at different times. Behind the image are orbit determination, sensor calibration, image registration, terrain correction, atmospheric modelling, phase unwrapping, and reference selection.
Handled carefully, that chain can reveal motion too small to see across terrain too large to survey point by point. The result is not merely a picture of the ground. It is a record of how the distance between Earth and an orbiting instrument changed—and what that change may say about the forces reshaping the surface.
Sources and Further Reading
NASA Earthdata: The SAR Handbook
NASA Jet Propulsion Laboratory: Napa Earthquake Ground Deformation
NASA Jet Propulsion Laboratory: InSAR Measurements of Central Valley Subsidence
U.S. Geological Survey: Ground Deformation and Gravity for Volcano Monitoring